
Visualizing Disaster Response with ChatGPT
# Government
# AI Techniques
# ChatGPT
Use schematics, cutaways, and timelines to explain complex disaster-response systems.
2026年9月1日
Laura Keenan
一部のコンテンツは元の言語で表示される場合があります。
翻訳
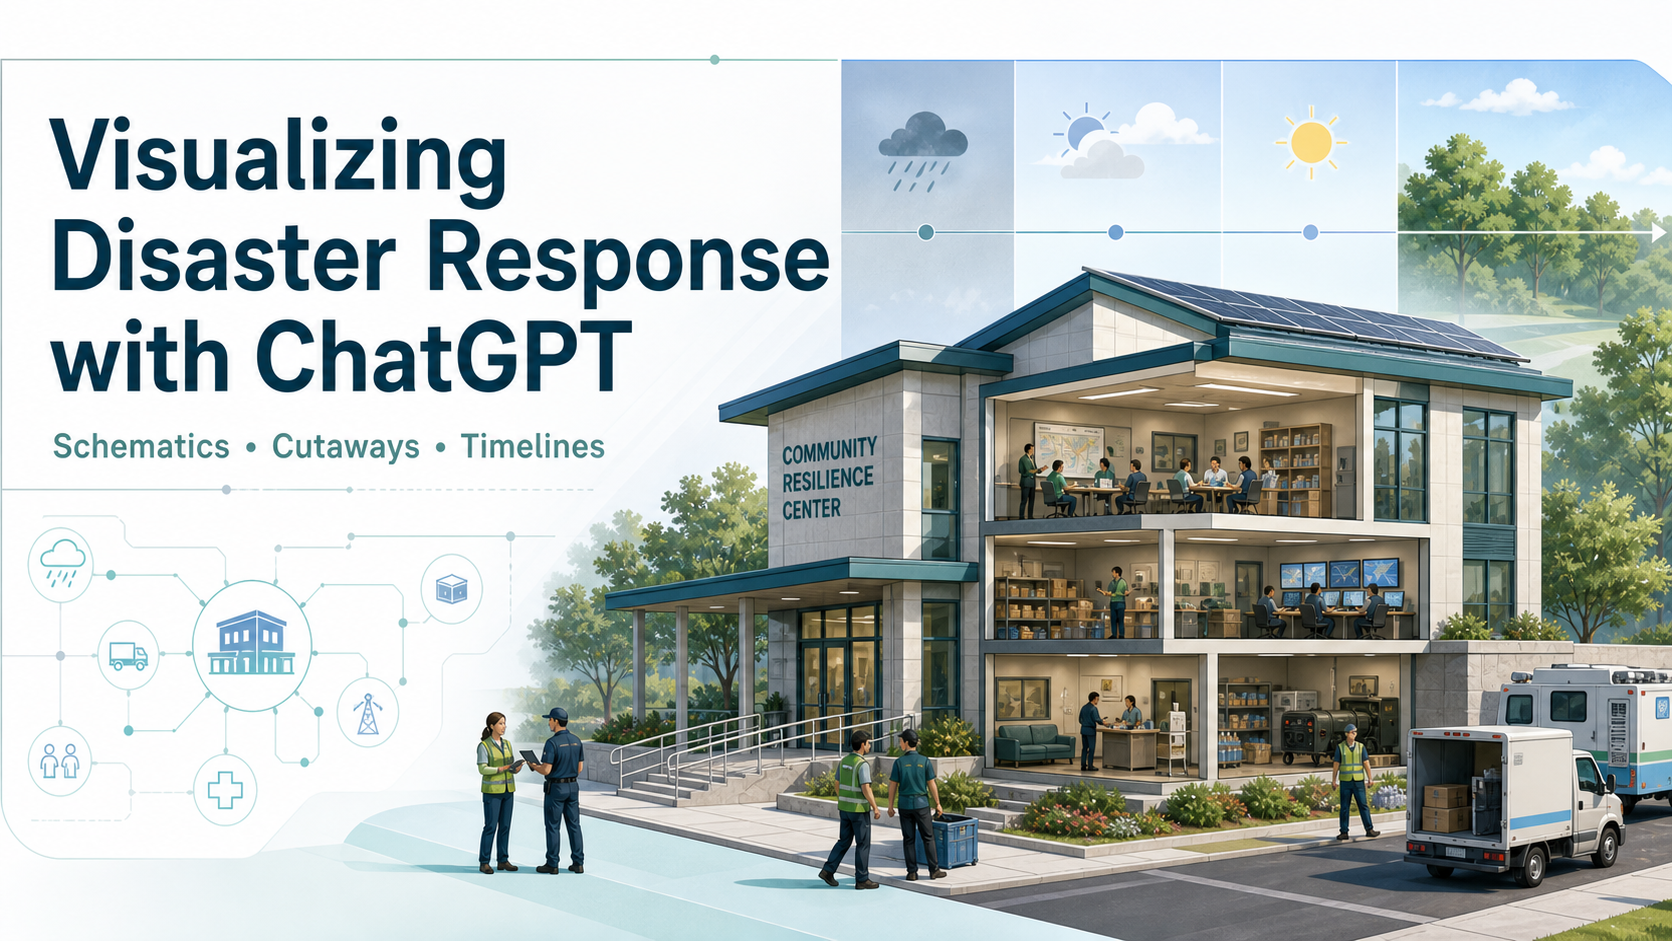
Disaster response depends on many organizations working together under pressure. Emergency managers, public-safety teams, health departments, transportation agencies, utilities, housing authorities, nonprofits, and federal partners may all see a different part of the same incident.
Generative images can help teams explain those connections, prepare stakeholders, and communicate complicated ideas more clearly. Three useful visual approaches are schematics, cutaways, and time-sequence images.
For this demonstration, I used a fictional community resilience center preparing for a major storm.
WHO CAN USE THIS APPROACH
This exercise is useful for any agency that prepares for, responds to, or helps communities recover from disasters. Examples include:
• Federal Emergency Management Agency (FEMA)
• National Oceanic and Atmospheric Administration (NOAA) and the National Weather Service
• U.S. Forest Service and Department of the Interior wildfire teams
• Department of Health and Human Services, including CDC and ASPR
• Department of Transportation and state transportation departments
• Department of Housing and Urban Development and local housing authorities
• Environmental Protection Agency
• U.S. Army Corps of Engineers
• State, local, tribal, and territorial emergency-management agencies
• Public-safety, public-health, utility, transit, shelter, and public-works organizations
The same techniques also help partners such as hospitals, nonprofits, volunteer organizations, schools, and community-based organizations explain how their work connects to the larger response.
A STRONG LIVE DEMO
A strong demonstration starts with one scenario and improves it in three visible steps. For example, use a fictional coastal community preparing for a major hurricane:
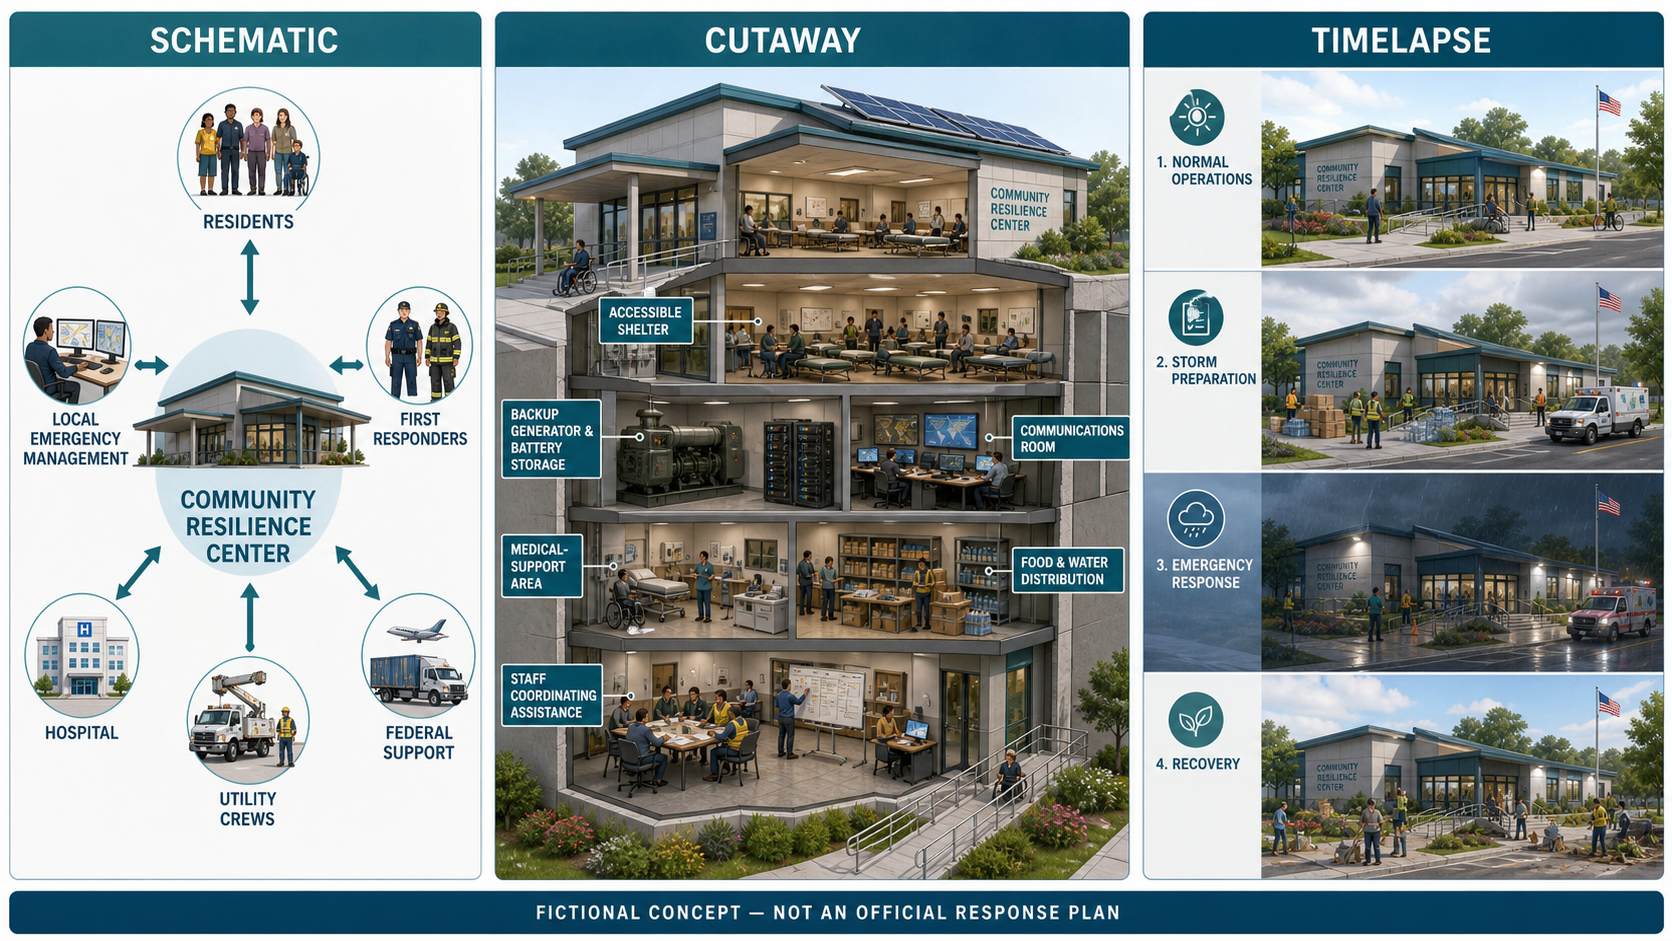
1. Begin with /schematic to show how residents, emergency managers, hospitals, transportation teams, utilities, nonprofits, and federal partners exchange information and resources.
2. Continue with /cutaway to show how a fictional resilience center supports accessible sheltering, backup power, communications, medical assistance, and supply distribution.
3. Finish with /timelapse to show the same community during normal operations, preparation, landfall and response, and recovery.
After each image, ask the audience what is missing or unclear. Then revise the prompt in real time—for example: “Add accessible transportation, multilingual public alerts, and a clearly marked process for requesting medical assistance.” This shows that image generation is not a one-shot trick; it is an iterative way to clarify assumptions, reveal gaps, and improve communication.
A COMPLETE EXAMPLE PROMPT
“Create one wide, professional briefing visual about a fictional coastal community preparing for a major hurricane. Divide the image into three clearly labeled panels. Panel 1: a schematic showing coordination among residents, emergency management, first responders, hospitals, transportation teams, utilities, nonprofits, and federal partners. Panel 2: a cutaway of a fictional community resilience center with accessible sheltering, backup power, communications equipment, medical support, food and water distribution, and a coordination area. Panel 3: a four-stage time sequence showing normal operations, preparation, emergency response, and recovery. Keep the facility and visual style consistent across all panels. Use minimal readable labels, an accessible color palette, and diverse community members. Do not use real agency seals, real facility layouts, security-sensitive details, political branding, or geographic identifiers. Add a small footer: ‘Fictional concept for training and discussion—not an operational plan.’”
START WITH ONE SHARED SCENARIO
I began with a neutral foundation:
“Create a fictional community resilience center preparing for a major storm. Make the visual suitable for a professional government briefing. Do not depict a real facility, use agency seals, reveal security-sensitive information, or imply that the image is an official response plan.”
The same basic scenario can be adapted for hurricanes, flooding, wildfire, extreme heat, earthquakes, severe winter weather, public-health emergencies, or long-term community recovery.
/SCHEMATIC: SHOW HOW PARTNERS COORDINATE
A schematic helps people understand relationships, responsibilities, and the movement of information or resources.
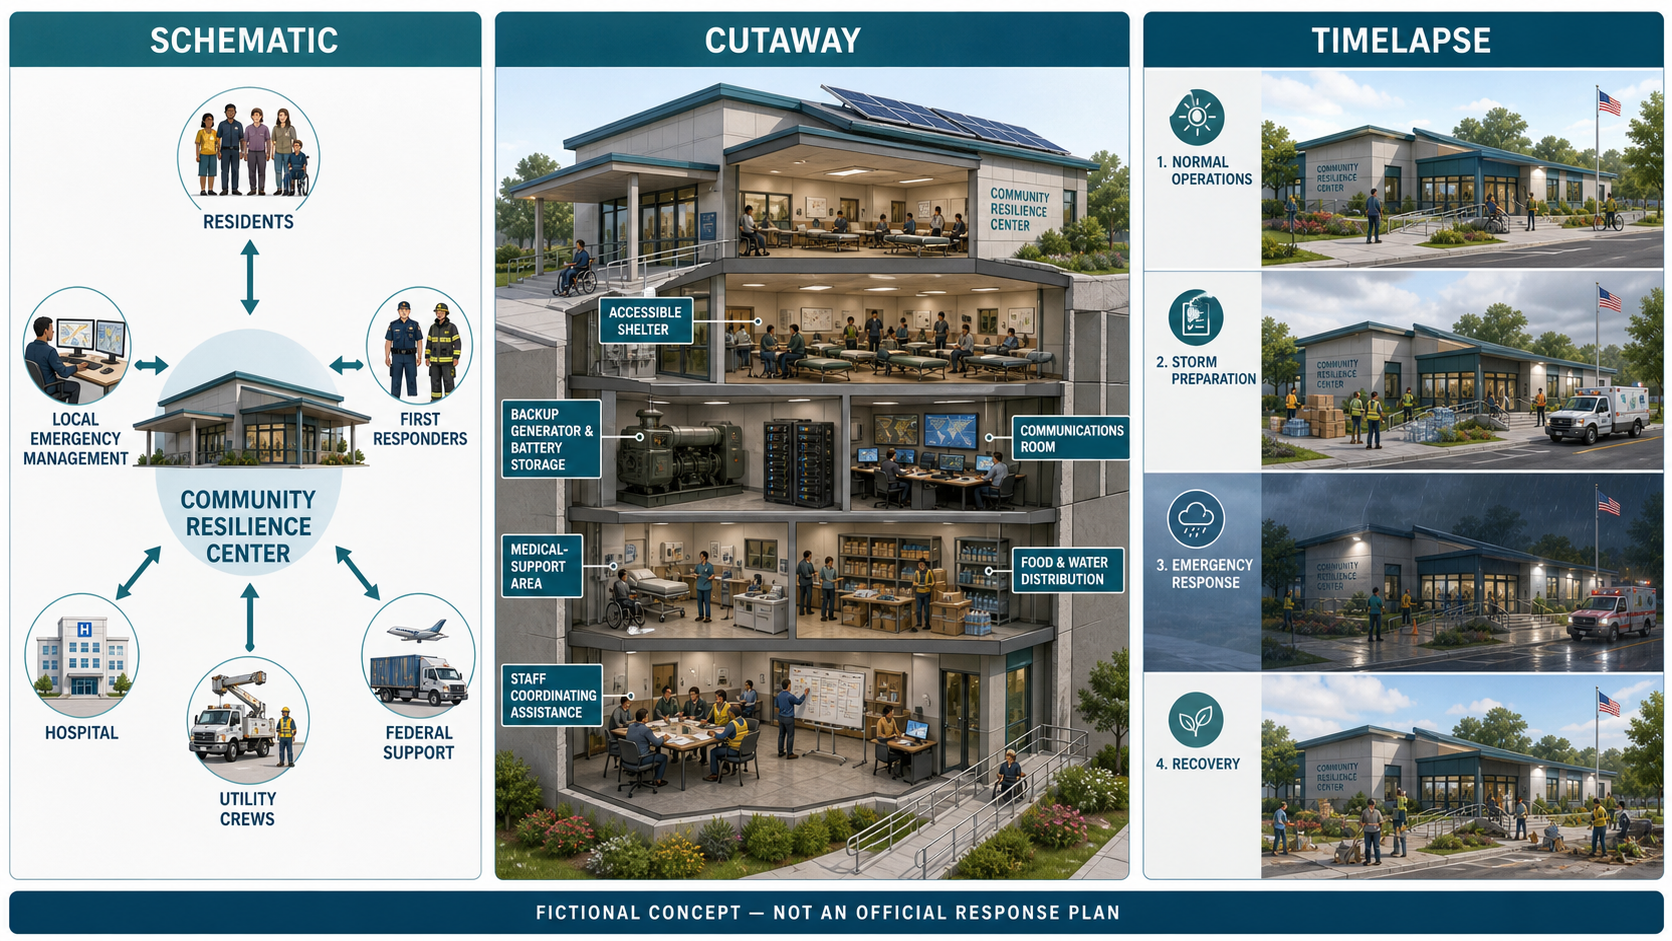
In the demonstration, the resilience center connects residents with emergency management, first responders, hospitals, utility crews, and federal support.
Try:
“/schematic Create a clean schematic showing how residents, emergency management, first responders, hospitals, utility crews, nonprofit organizations, and federal partners coordinate through a fictional community resilience center during a major storm. Use simple arrows, minimal labels, and a professional briefing style.”
This format could help agencies visualize:
• The flow of emergency information
• Resource-request and approval pathways
• Roles across federal, state, local, tribal, and territorial partners
• Public alerts and community feedback
• Distribution of food, water, medicine, shelter, and equipment
• The transition from response to recovery
/CUTAWAY: SHOW WHAT IS HAPPENING INSIDE
A cutaway reveals the internal parts of a facility, vehicle, piece of infrastructure, or operational system.
For this example, the image shows an accessible shelter, backup power, communications equipment, medical support, food and water distribution, and a coordination area.
Try:
“/cutaway Create an architectural cutaway of a fictional community resilience center operating during a major storm. Show an accessible shelter, backup generator and battery storage, communications equipment, a medical-support area, food and water distribution, and staff coordinating assistance. Make the systems understandable to a nontechnical audience.”
Agencies could apply this format to emergency shelters, mobile command centers, hospitals, water systems, power infrastructure, temporary housing, distribution centers, or resilient public buildings.
A cutaway should remain conceptual unless it is created from approved technical information. It should never expose actual security systems, vulnerabilities, restricted layouts, or protected infrastructure details.
/TIMELAPSE: SHOW HOW CONDITIONS CHANGE
Disasters unfold over time. A time-sequence image can show the progression of an event, the changing needs of a community, or the shift from readiness to recovery.
For the demonstration, I showed the same center during normal operations, storm preparation, emergency response, and community recovery.
Try:
“/timelapse Show the same fictional community resilience center in four stages: normal operations, storm preparation, emergency response, and recovery. Keep the facility and viewing angle consistent. Show how staffing, supplies, transportation, public services, and community activity change during each stage.”
This approach could help visualize:
• Forecasted versus actual storm effects
• Evacuation and shelter activation
• Flooding, wildfire spread, or changing weather conditions
• Infrastructure damage and restoration
• Delivery of emergency supplies
• Temporary housing and long-term recovery
• Changes in community needs over days, weeks, or months
HOW I CREATED THE COMBINED VISUAL
I asked ChatGPT to place all three approaches into one wide image. To keep the result coherent, I specified:
• One consistent fictional facility
• Three clearly separated visual sections
• A professional, accessible color palette
• Minimal, readable labels
• Visible accessibility features
• A range of response partners and community members
• No real seals, logos, political branding, or geographic identifiers
• A footer stating that the image is a fictional concept
These details helped turn three visual techniques into one connected explanation.
ADAPT THE EXERCISE TO YOUR MISSION
After generating the first image, replace the storm scenario with a mission-relevant challenge.
For example:
“Keep the same layout and professional style, but adapt the scenario to a rural wildfire response involving evacuation support, temporary shelter, utility restoration, animal care, and public-health coordination.”
A transportation agency might focus on route access and debris removal. A health department might focus on medical capacity and continuity of care. A housing agency might show the path from temporary shelter to long-term recovery. A utility could explain service restoration and community priorities.
The first image is a draft. Ask ChatGPT to simplify it, remove unnecessary elements, improve accessibility, change the audience, or correct specific details.
REVIEW BEFORE YOU SHARE
Generated images can help teams explore and communicate ideas, but they are not operational plans, engineering diagrams, forecasts, or verified records of an incident.
Before using an image:
• Confirm that labels and relationships are accurate.
• Remove invented or misleading details.
• Check that the image reflects approved roles and terminology.
• Avoid protected, sensitive, or operationally specific information.
• Clearly identify conceptual images when they could be mistaken for official guidance.
• Have the appropriate subject-matter experts review the result.
If a particular slash command does not appear in ChatGPT, write the request in ordinary language: “Create a schematic,” “Create a cutaway,” or “Show the scenario changing over four stages.” Type / in the message box to see which actions are available in the current account and conversation.
DEMO VISUAL
Below is the generated three-part example combining a schematic, cutaway, and time-sequence view.
Who might use this approach
This exercise is useful for organizations that need to explain how a disaster may unfold, how people and systems work together, or what changes between preparedness, response, and recovery. Here are some ideas for inspiration:
- Federal Emergency Management Agency (FEMA): Show how federal assistance connects with state, local, tribal, and territorial operations; explain resource coordination, sheltering, and the transition to recovery.
- National Oceanic and Atmospheric Administration (NOAA) and the National Weather Service: Turn forecasts and changing hazards into clear visual sequences that help nontechnical audiences understand timing, uncertainty, and potential impacts.
- U.S. Forest Service and Department of the Interior wildfire teams: Illustrate wildfire progression, evacuation support, interagency coordination, and the movement of crews and resources without depicting sensitive operational details.
- Department of Health and Human Services, including CDC and ASPR: Explain medical surge capacity, public-health coordination, continuity of care, supply distribution, and how community needs may change during an emergency.
- Department of Transportation and state transportation departments: Visualize evacuation routes, road closures, transit support, debris removal, and the restoration of transportation networks.
- Department of Housing and Urban Development and local housing authorities: Show the path from emergency shelter to temporary housing and longer-term community recovery.
- Environmental Protection Agency: Explain environmental hazards, water and air monitoring, debris management, and how technical findings connect to protective actions for communities.
- U.S. Army Corps of Engineers: Make flood-control systems, temporary infrastructure, debris missions, power support, and infrastructure-restoration concepts easier to understand.
- State, local, tribal, and territorial emergency-management agencies: Create community-specific visuals for preparedness campaigns, emergency operations, public briefings, and after-action discussions.
- Public-safety, public-health, utility, transit, shelter, and public-works organizations: Show how frontline services depend on one another and where coordination, access, or resource gaps may emerge.
Hospitals, nonprofits, volunteer organizations, schools, and community-based organizations can use the same techniques to explain their role in the larger response and help residents understand where to go, what to expect, and how services connect.
探索する
関連
ブログ
Before it exists: 6 ways to visualize a disaster-relief kit
投稿者 Laura Keenan • 2026年9月9日 • 視聴回数 95
リソース
From One-Off Request to Reusable Practice: Building Legal Workflows with ChatGPT Work
投稿者 Laura Keenan • 2026年8月4日 • 視聴回数 206
ビデオ
Getting Started with ChatGPT Enterprise for Government Employees
投稿者 David Sperry • 2025年7月19日 • 視聴回数 357
リソース
How to get started guide: Conducting performance reviews with ChatGPT Work
投稿者 Laura Keenan • 2026年7月20日 • 視聴回数 137
ブログ
Before it exists: 6 ways to visualize a disaster-relief kit
投稿者 Laura Keenan • 2026年9月9日 • 視聴回数 95
ビデオ
Getting Started with ChatGPT Enterprise for Government Employees
投稿者 David Sperry • 2025年7月19日 • 視聴回数 357
リソース
How to get started guide: Conducting performance reviews with ChatGPT Work
投稿者 Laura Keenan • 2026年7月20日 • 視聴回数 137
リソース
From One-Off Request to Reusable Practice: Building Legal Workflows with ChatGPT Work
投稿者 Laura Keenan • 2026年8月4日 • 視聴回数 206